Following Bitcoin’s (BTC) sell-off earlier in the week, the flagship cryptocurrency is seemingly struggling to break past the $60,000 mark.
Notably, there is growing concern regarding the asset’s price trajectory, with an analyst forecasting more challenging times ahead if Bitcoin continues to hover around its current levels.
In this context, analyst Ali Martinez warned in an X post on August 31 that the Bitcoin community should be wary of a possible long-term bear market.
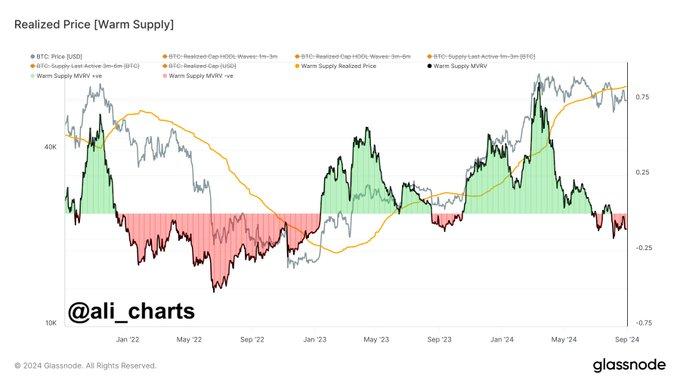
Martinez emphasized the importance of the “warm supply realized price,” currently pegged at $66,000. He explained that Bitcoin’s price typically signals a positive trend when it stays above this level. Conversely, if the price dips below $66,000 and remains there, it could begin a prolonged bear market.
Additionally, Martinez illustrated how Bitcoin’s price has interacted with the warm supply realized price over the past few years. According to the crypto analysis platform Glassnode data, Bitcoin is currently struggling to reclaim this critical level.
Bitcoin realized price chart. Source: Glassnode/Ali_Charts
The Bitcoin warm supply realized price is calculated based on the average purchase price of coins inactive for one to three months, and it highlights recent market activity. Monitoring this metric can offer insights into market trends and investor confidence. Additionally, it serves as a valuable tool for predicting future price movements.
Bitcoin’s potential bullish scenario
Notably, the projection comes as Bitcoin enters September, a month historically known to be bearish for the digital asset. However, crypto analyst with the pseudonym Stockmoney Lizards suggested in an X post on August 31 that September could offer an opportunity for Bitcoin investors.
The expert acknowledged that, historically, September has been a month of mixed emotions for traders and investors. On the one hand, it has often been viewed as a period of volatility, where markets tend to waver as the summer trading lull gives way to the year’s final quarter.
The expert highlighted three crucial years: 2020, 2023, and 2024. The analysis raised an intriguing possibility by comparing market movements around September 1 across these years. The patterns observed suggest that September might often act as a pivotal point in bull markets, where prices either consolidate before a significant upward move or begin to falter, marking the onset of a downturn.
Bitcoin price movement chart. Source: Stockmoney Lizards
In many bull markets, September has been a month of consolidation, where prices stabilize before entering a strong upward trajectory in the year’s final quarter. This pattern was notably observed in 2020 when, after a turbulent September, the market experienced a remarkable rally in Q4, driven by renewed investor confidence and strong corporate earnings.
On the other hand, September could also signal the end of the current bull run. The logic is that the market may be due for a correction after prolonged gains. September’s historical reputation as a challenging month for stocks could amplify these risks, especially if investors begin to take profits ahead of perceived uncertainties in Q4.
Bitcoin price analysis
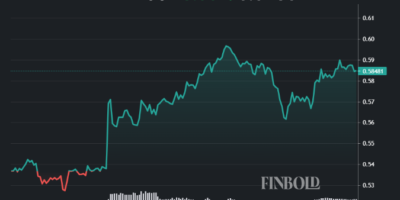
Bitcoin was trading at $59,081 at press time, with daily losses of 0.3%. On a weekly timeframe, BTC is down almost 8%.
Bitcoin seven-day price chart. Source: Finbold
All factors considered, Bitcoin’s push towards the $66,000 mark means the asset must first reclaim the $60,000 resistance level. However, continued consolidation below this level could dull investor momentum, leading to possible further losses.
Disclaimer: The content on this site should not be considered investment advice. Investing is speculative. When investing, your capital is at risk.
The post Long bear market alert if Bitcoin stays under this key price level appeared first on Finbold.


