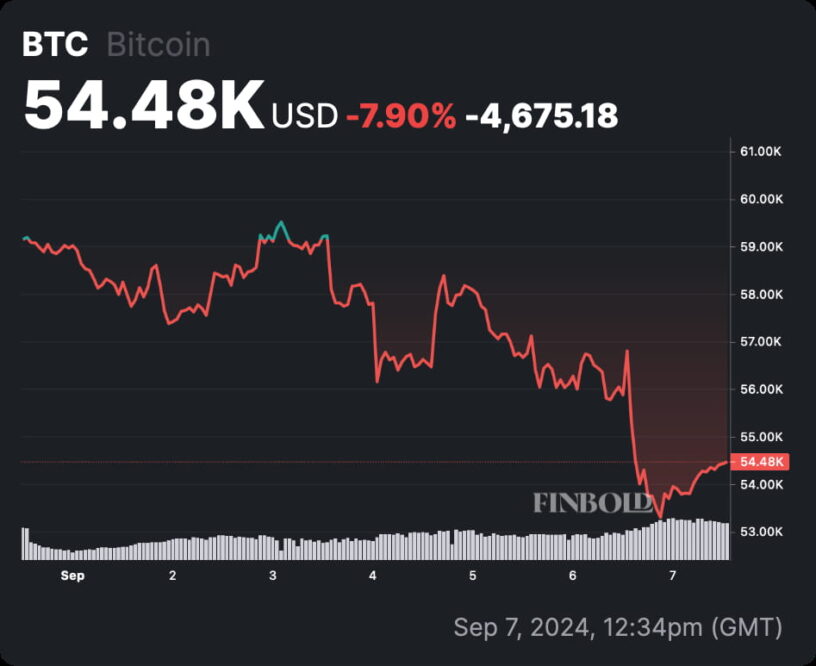
Bitcoin (BTC) crashed to $52,568 on September 6, up to 10.85% losses since the start of the month. Amid discussions about the “September Effect” punishing Bitcoin investors, a prominent analyst shows optimism as BTC reaches the “downside target.”
The analyst is Credible Crypto, a Bitcoin long-term bull who signals his current bias through the X alias CrediBULL Crypto. Notably, the trader had previously shown a bearish bias in the past few months, warning of an impending BTC retracement.
This recent crash has now changed Credible Crypto‘s short-term Bitcoin price prediction, and he believes in an incoming bullish reversal. Moreover, the analyst explained that given how fast BTC crashed, the “full bull gear” may come “sooner than expected.”
As observed in the chart, Bitcoin could soon target the $100,000 psychological level as BTC’s fifth impulse wave. The analyst refers to this wave according to the Elliott Wave theory and believes it would mark this cycle’s top.
What other analysts say about Bitcoin (BTC) price
As of this writing, BTC trades at $54,480, down 7.90% in a week.
Bitcoin (BTC) one-week price chart. Source: Finbold
Notably, the recent crash also reached other analysts’ downside targets before a forecasted higher time frame bull rally. In particular, Finbold reported CrypNuevo‘s trading plan for the week last Sunday, which played out as expected.
The trader predicted Bitcoin would go through a “run for liquidity” up to $61,300 – partially accomplished at $59,799. And then crashing back to a range between $51,500 and $56,600, chasing imbalances created by long-position traders.
Bitcoin (BTC) 4-hour price chart on Binance. Source: TradingView / CrypNuevo / Finbold
On September 6, before the crash, Finbold also published another analyst’s warning of “a bear trap before the spike.” On that note, the expert who goes by The ForexX Mindset on TradingView predicted BTC would briefly break out of a bull diamond chart pattern to the downside, trapping Bitcoin short-sellers.
The analyst projected a target between $50,000 and $55,000 for this bear trap, which BTC successfully achieved.
Bitcoin (BTC) 3-day price chart on Coinbase. Source: TradingView / The ForexX Mindset / Finbold
Should Bitcoin continue meeting these three analysts’ projections, the cryptocurrency market could see a drastic shift in the following days. Interestingly, the predominant bearish sentiment from retail validates what professional traders see as a local bottom and an incoming rally.
Nevertheless, cryptocurrencies are hard to predict, are influenced by different factors, and are also highly volatile assets. Investors should remain cautious and properly weigh their risks despite the reported positive forecasts.
Disclaimer: The content on this site should not be considered investment advice. Investing is speculative. When investing, your capital is at risk.
The post Bitcoin reaches ‘downside target’ and BTC ‘full bull gear’ can start appeared first on Finbold.


